
Grafana: Empowering Data Visualization and Real-Time Monitoring
Empower Your Monitoring and Visualization Efforts with the Power of Grafana


Here is an Over of Grafana:
Purpose: Grafana is an open-source platform used for monitoring, visualization, and analytics of time-series data. It empowers users to create interactive and customizable dashboards that display various metrics and data sources in real-time, helping organizations gain insights into their systems, applications, and business metrics.
Key Concepts:
Data Sources: Grafana can connect to a wide range of data sources, including databases (InfluxDB, Prometheus, Elasticsearch), cloud services (AWS CloudWatch, Azure Monitor), and more. These data sources provide the data that will be visualized in Grafana dashboards.
Dashboards: Dashboards are collections of panels that display different visualizations, metrics, and information. Users can arrange panels on a dashboard to create a meaningful visualization of their data.
Panels: Panels are individual components within a dashboard. They can display different types of visualizations, such as graphs, tables, and single statistics.
Queries and Visualizations: Grafana allows users to create queries that retrieve data from data sources and visualize it using various visualization types. Common visualization types include line charts, bar graphs, tables, and more.
Alerting: Grafana provides alerting capabilities, allowing users to set up alerts based on specified conditions. When conditions are met, alerts can trigger notifications to various channels (Slack, email, etc.).
Templating: Templating enables the creation of dynamic dashboards. Users can define template variables that allow for interactive filtering and dynamic changes in the dashboard.
Plugins and Extensions: Grafana supports a rich ecosystem of plugins and extensions that enhance its capabilities. These plugins can provide additional visualizations, data sources, and integrations.
Architecture:
Grafana follows a client-server architecture:
Client: The Grafana frontend runs in the user's web browser. It's responsible for rendering dashboards, panels, and visualizations.
Server: The Grafana backend (server) manages user authentication, data source connections, alerting, and dashboard rendering. It interacts with various data sources to retrieve and present data to users.
Workflow:
Users configure data sources (databases, cloud services) that Grafana will query for data.
Users create dashboards and panels in the Grafana UI, selecting data sources and defining queries.
Grafana fetches data from the configured data sources using queries.
Data is visualized using selected visualization types and displayed in panels.
Templating variables and dynamic features allow users to interact with the data and customize the dashboard.
Alert rules are set up to monitor specific conditions, triggering notifications when thresholds are met.
Use Cases:
Grafana finds applications in various domains:
Infrastructure Monitoring: Monitoring server performance, network metrics, and infrastructure health.
Application Monitoring: Tracking application metrics, troubleshooting performance issues, and ensuring user experience.
Business Metrics: Visualizing business-related metrics such as sales, revenue, and customer engagement.
IoT Data Analysis: Visualizing and analyzing time-series data generated by IoT devices.
Log Analysis: Correlating log data with performance metrics for troubleshooting and anomaly detection.
In summary, Grafana is a versatile platform that allows users to create powerful, dynamic dashboards for monitoring, analyzing, and visualizing time-series data from various sources, making it an essential tool in the field of data visualization and monitoring.
Let's do a mini-project here:
Note: Before going ahead we must be aware of two different terms: Loki & Promtail
The function of Loki and Promtail in Grafana
Grafana offers a variety of tools to enhance monitoring and visualization capabilities, and two prominent components within its ecosystem are Loki and Promtail. These components are designed to handle log aggregation and visualization, complementing Grafana's capabilities in time-series data analysis.
1. Loki: Log Aggregation and Visualization
Loki is a highly efficient and horizontally scalable log aggregation system that aims to simplify the collection, storage, and exploration of log data. It is integrated with Grafana, providing users with a seamless experience when working with both metrics and logs.
2. Promtail: Log Collector and Shipper
Promtail is a lightweight log collector and shipper designed to efficiently collect log data from various sources and send it to Loki for storage and analysis.
Now coming to the project -
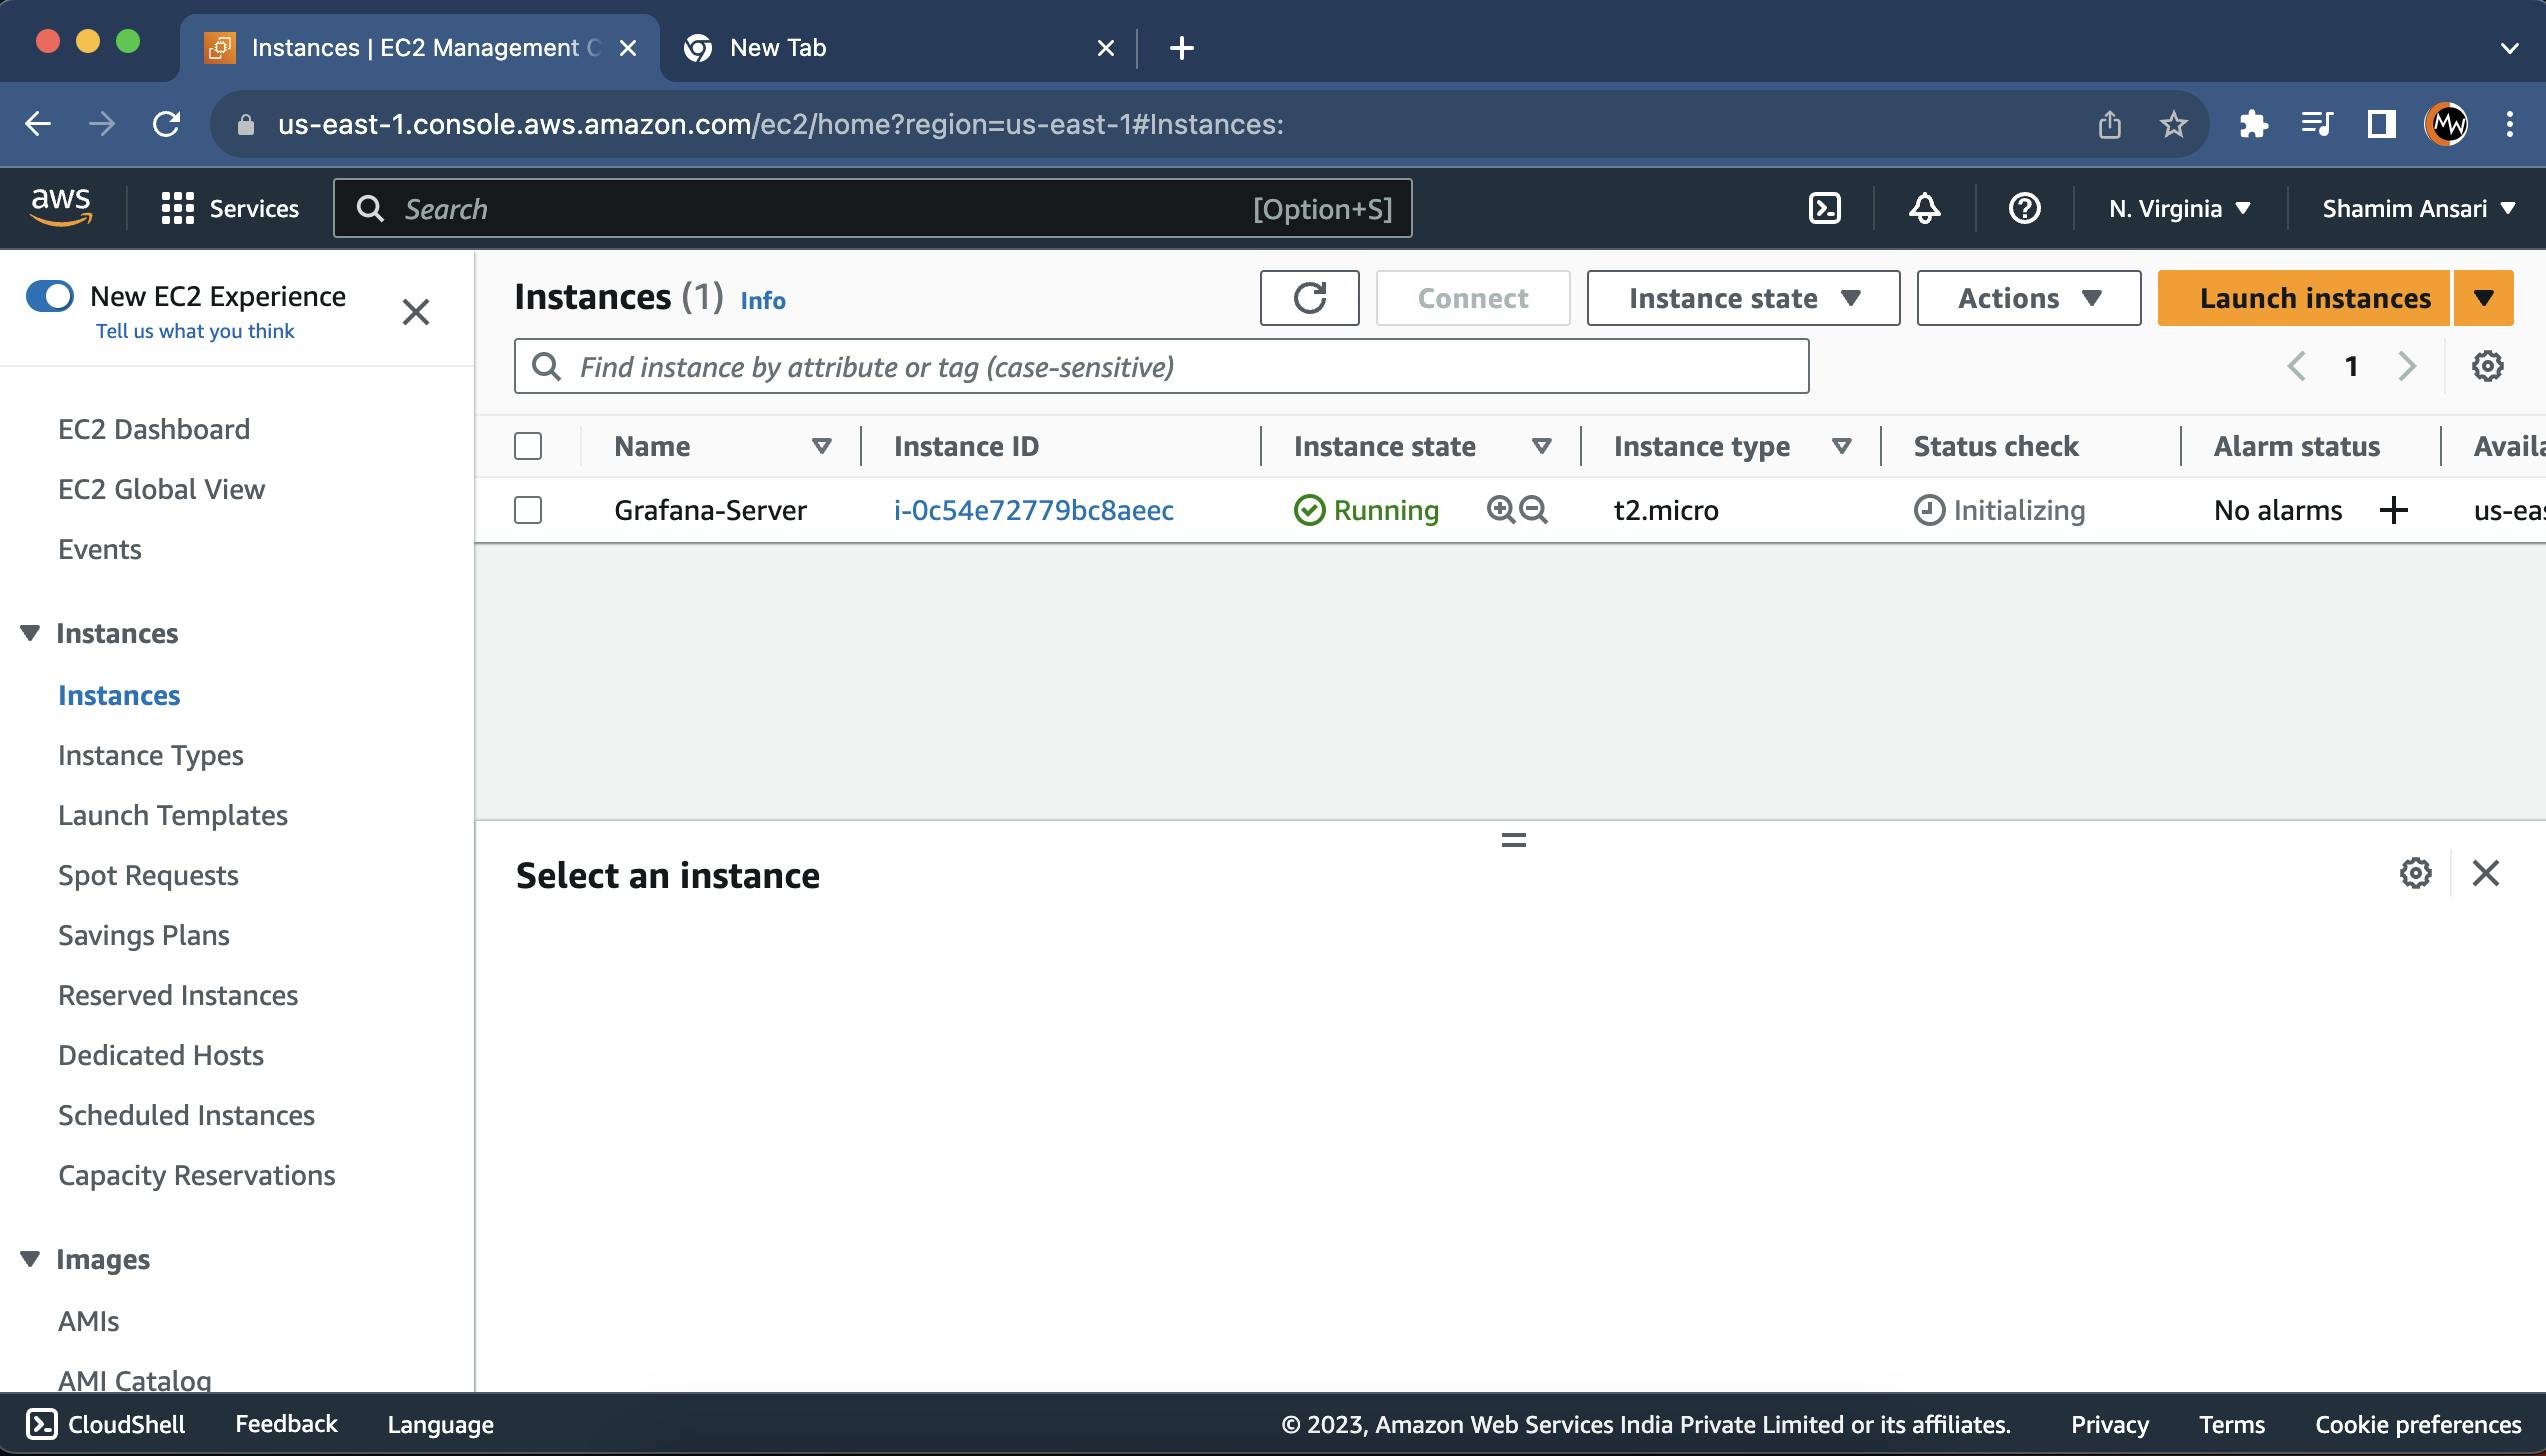
Step-1: Launch an EC2 instance in AWS Console as per below screenshot summary-

Step-2: Access your server using 'Terminal'
ssh -i [key pair name] ubuntu@[public Ip]
Step-3: Install Grafana on Debian or Ubuntu
sudo apt-get update
sudo apt-get install -y apt-transport-https
sudo apt-get install -y software-properties-common wget
sudo wget -q -O /usr/share/keyrings/grafana.key https://apt.grafana.com/gpg.key
Stable release:
echo "deb [signed-by=/usr/share/keyrings/grafana.key] https://apt.grafana.com stable main" | sudo tee -a /etc/apt/sources.list.d/grafana.list
# Update the list of available packages
sudo apt-get update
# Install the latest OSS release:
sudo apt-get install grafana
sudo systemctl start grafana-server
sudo systemctl enable grafana-server
Note: Grafana runs on 3000 port so allow and edit the same port in inbound rules

Now access Grafana in the browser using public ip with a 3000 port-

Note: By default both username and password is 'admin'. Set it as per your choice
Grafana's home screen will look like this -

Step-4: Install Loki and Promtail using Docker
sudo apt-get install docker.io
sudo usermod -aG docker $USER
sudo reboot
Note: Wait for 1-2 minutes after rebooting the server and access again
mkdir grafana_configs
Download Loki Configwget https://raw.githubusercontent.com/grafana/loki/v2.8.0/cmd/loki/loki-local-config.yaml -O loki-config.yaml
Run Loki Docker container
docker run -d --name loki -v $(pwd):/mnt/config -p 3100:3100 grafana/loki:2.8.0 --config.file=/mnt/config/loki-config.yaml
Note: Loki runs on 3100 port so allow and edit the same port in inbound rules

Download Promtail Config
wget https://raw.githubusercontent.com/grafana/loki/v2.8.0/clients/cmd/promtail/promtail-docker-config.yaml -O promtail-config.yaml
Run Promtail Docker container
docker run -d --name promtail -v $(pwd):/mnt/config -v /var/log:/var/log --link loki grafana/promtail:2.8.0 --config.file=/mnt/config/promtail-config.yaml
Go to Grafan's dashboard and add 'Data Source'
Edit URL under HTTP as shown below with red circle

Click on 'Save & test'

Now click on 'Explore'
Choose 'job' and ''varlogs under Label Filters and run query

Logs after running query-

Go to Terminal -
cd /var/
cd log
cd grafana/
Check and copy present working directory
pwd
cd
cd grafana_configs/
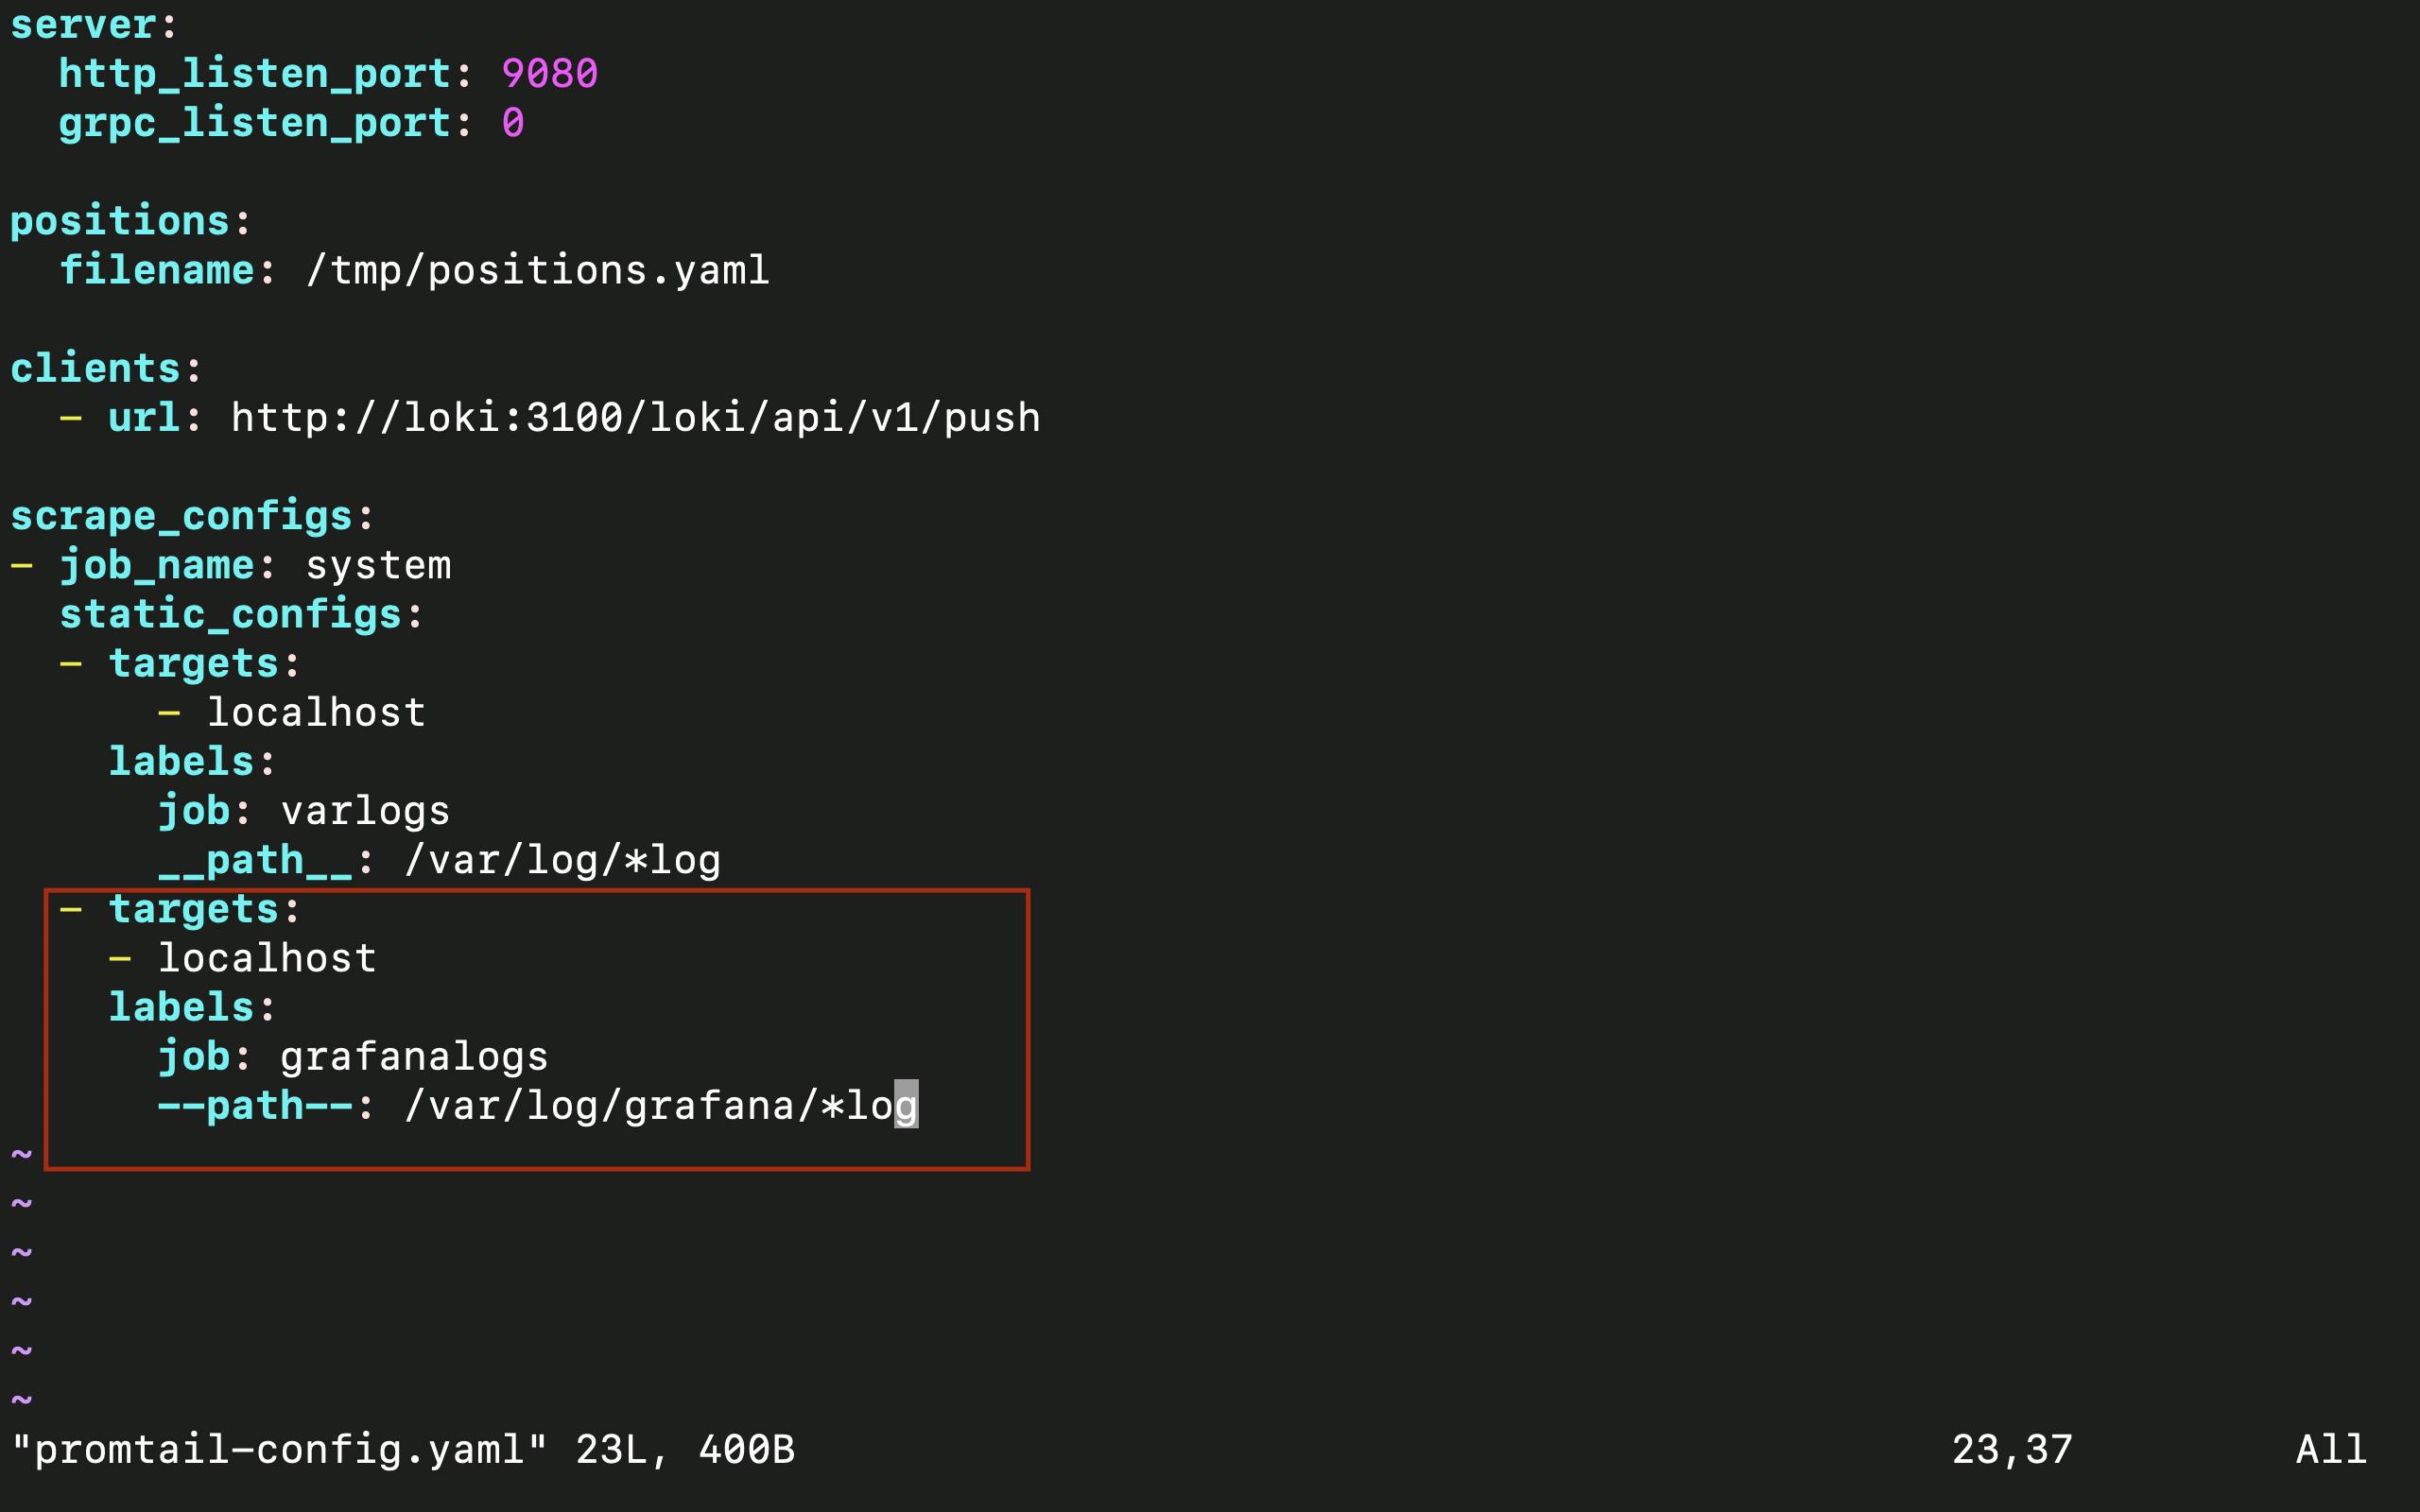
vim promtail-config.yml
Add in targets here as shown below in red circle
Now restart docker promtail server
docker restart [container-id]
Go to Grafana browser and refresh it, you will see grafanalogs under 'Label Filters' and 'Run query' to get logs

Click on 'Add to dashboard' --> 'Open Dashboard'
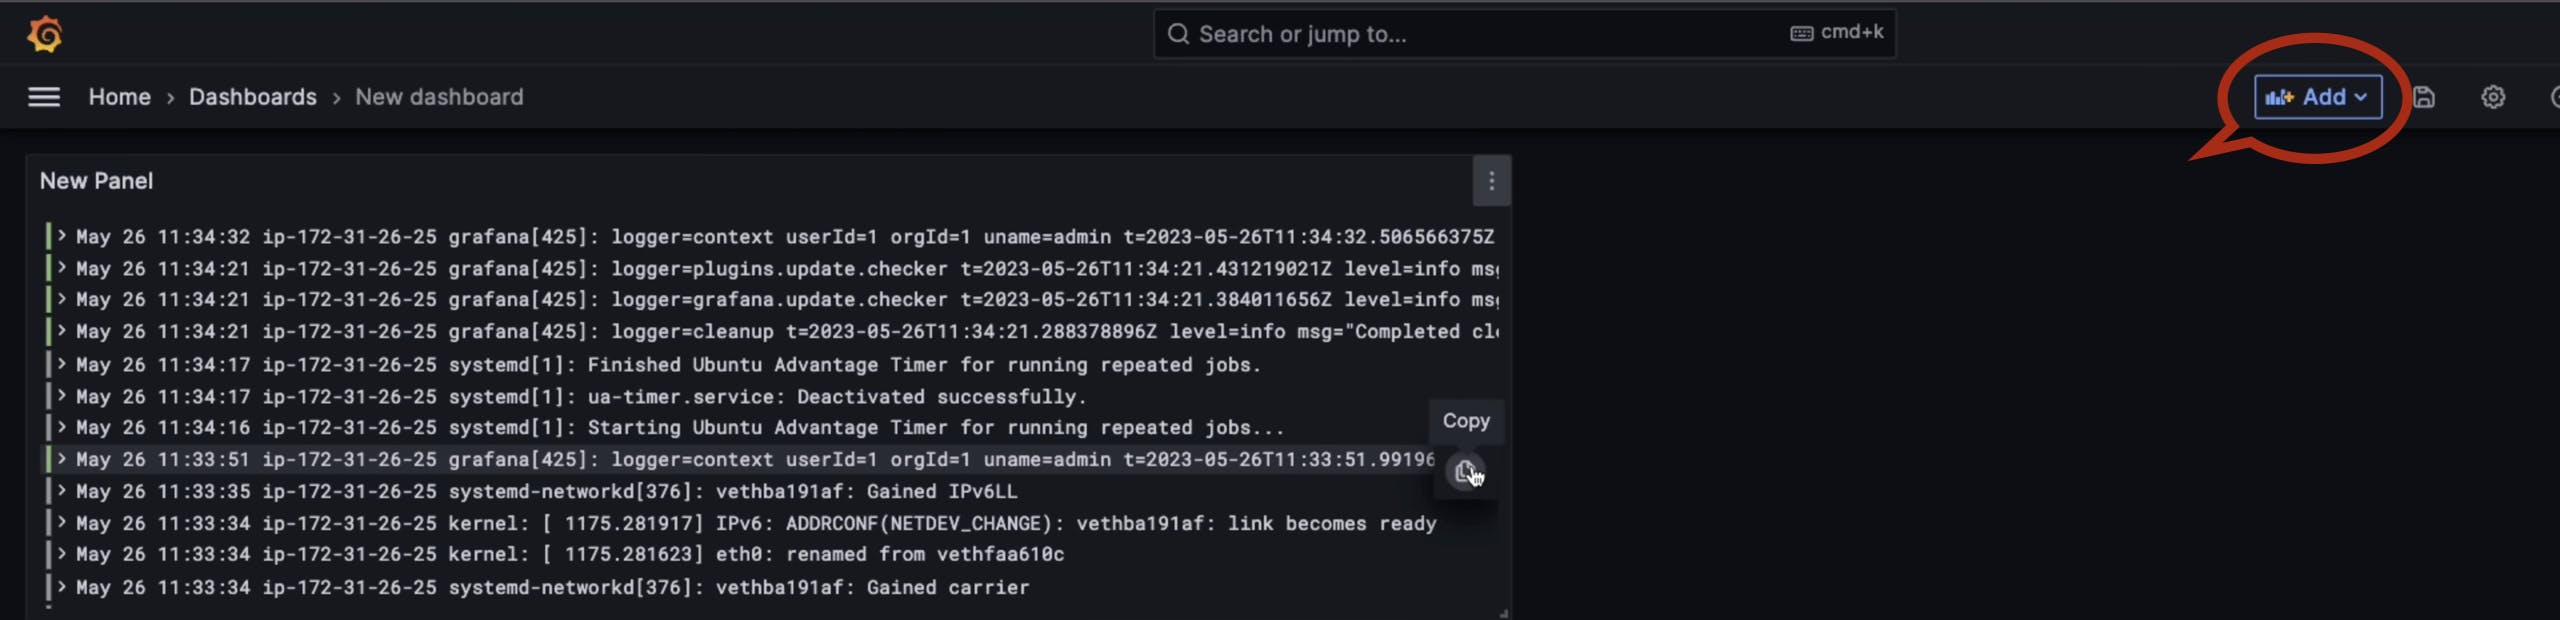
Click Add --> Visualization
Note: It will not show any data so to get data here just install any application e.g. Nginx just to generate some logs
sudo apt-get install nginx -y
Select label filters as shown below

Click on 'Open Visualization suggetions' --> choose logs

Click on 'Operation' --> Range function --> Rate and run the query

Click on 'Apply' now
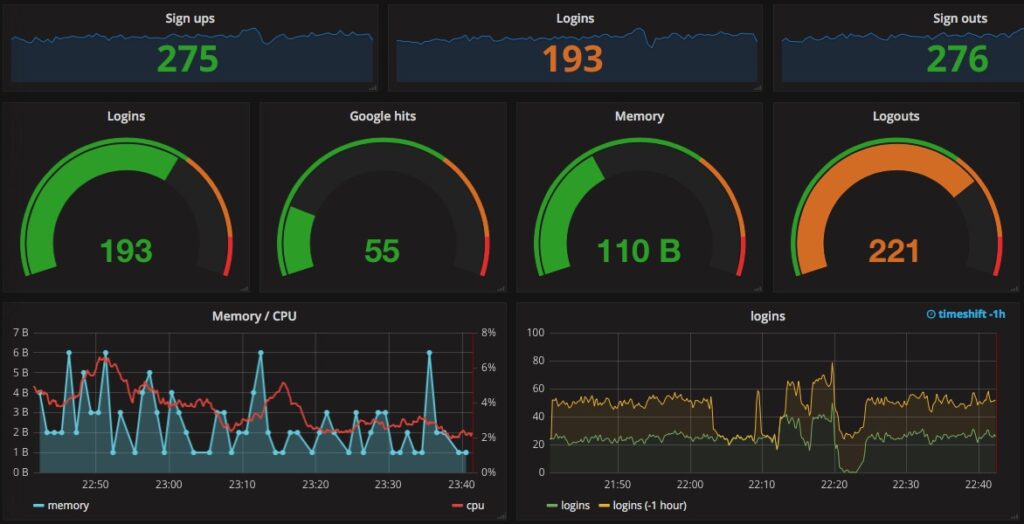
Just do the same steps and get the logs as per your requirements and apply those to add in your New Dashboard which will look like -

Congratulations! You have successfully completed a mini-project on Grafana.